Growth charts and growth monitoring
- Introduction...
- 1. Learning object...
- 2. Premature infan...
- 3. Post natal grow...
- 4. Objectives of ...
- 5. Growth paramete...
- 6. Growth charts c...
- 7. Gender specific...
- 9. Ehrenkranz post...
- 10. Plotting growt...
- 11. Reasons for po...
- 12. Key messages...
- 8. Fenton charts 2...
 |
 |
Introduction
DR. JAYASHREE MONDKAR
MD, DM (Neonatology)
Professor & Head
Department of Neonatology
LTMMC and Sion Hospital
Mumbai
1. Learning objectives
► Need for growth monitoring of preterm babies
► Growth parameters to be measured
► Which growth charts to be used?
► How to plot growth charts?
► Identification of growth impairment
► Management of growth impairment
2. Premature infants
► Premature infants have greater nutritional needs to
achieve optimal growth
► Due to inherent limitations, many VLBW babies have
cumulative deficits in protein and energy
► Show slower growth than intrauterine
counterparts, causing EUGR
► Provision of adequate nutrition from birth along with
growth monitoring is essential to prevent this
3. Post natal growth targets
► Expected as per intrauterine growth
♦ Weight – 15 to 18 gm/ kg/ day
♦ Length – 0.9 - 1 cm/ week
♦ Head circumference – 0.7 to 0.9 cm/ week
4. Objectives of growth monitoring
► To ensure that post natal growth is as optimal as possible
♦ Baby is growing along birth centile
► For early identification & management of growth impairment
► To assess response to interventions
5. Growth parameters to be tracked

6. Growth charts commonly used
► Intrauterine growth curves
♦ Anthropometric data at birth from preterm
babies delivered at various gestations
♦ Example: Fenton’s charts, Intergrowth 21st charts
► Post natal growth curves
♦ Based on longitudinal post natal weights of preterm
babies at various gestations
♦ Example: Ehrenkranz charts
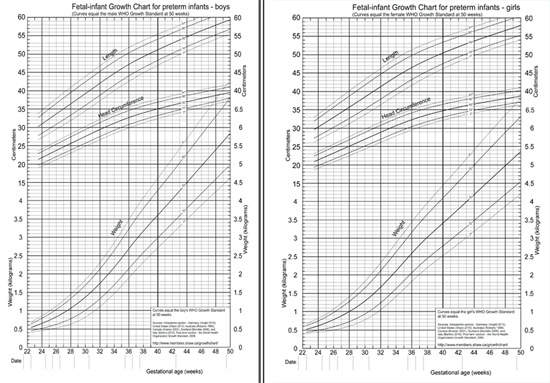
7. Gender specific Fenton charts 2013
► Called standard or prescriptive charts
► Gender specific
► Used for categorizing into AGA/ SGA/ LGA
► Equivalent to WHO growth charts at 50 weeks gestation -
so no change in centile when transitioning at term
gestation
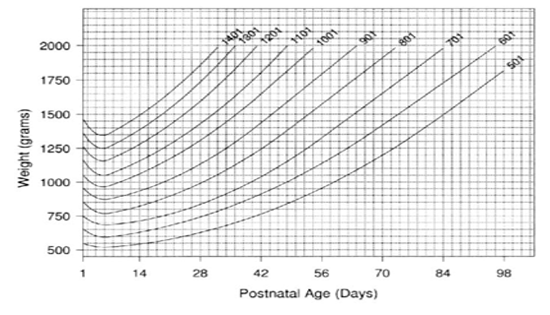
9. Ehrenkranz post natal growth charts
♦ Longitudinal curves represent postnatal growth
♦ Portray how babies grow after birth
♦ Called reference charts
♦ Allow for the initial postnatal weight loss seen in newborn
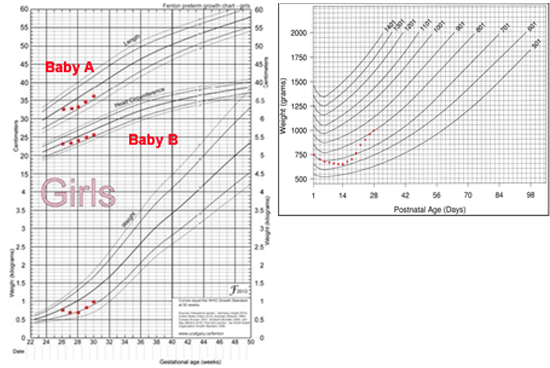
10. Plotting growth of 30 weeks 1100 grams, for first 28 days
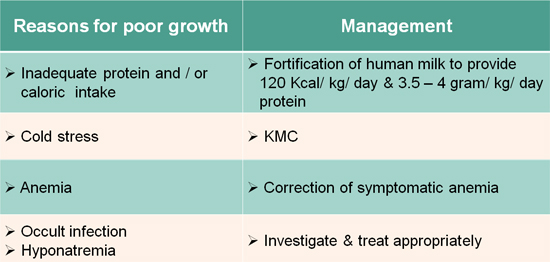
11. Reasons for poor growth & management
12. Key messages
► VLBW & ELBW's prone to EUGR
► Growth monitoring of weight, length & head circumference
is essential for all preterm babies
► Monitor on fenton’s (prescriptive) for classification of nutritive
status at birth and Ehrenkranz (descriptive) charts after birth
► Use growth charts to monitor faltering and to monitor
effectiveness of corrective intervention
► Fortification of mothers milk, KMC for improved growth
velocity
8. Fenton charts 2013